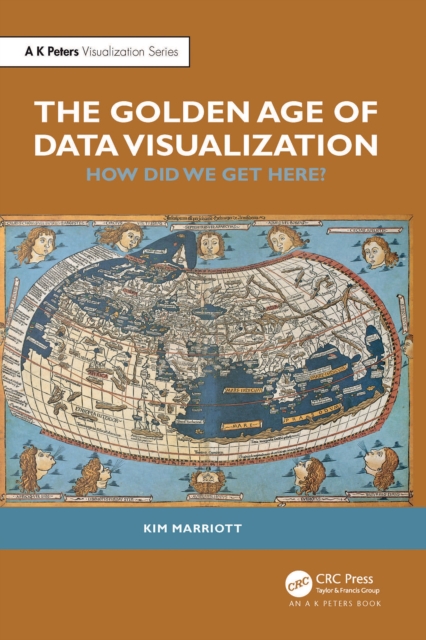
Golden Age of Data Visualization
We are living in the Golden Age of Data Visualization. The COVID-19 pandemic has demonstrated how we increasingly use data visualizations to make sense of the world. Business analysts fill their presentations with charts, journalists use infographics to engage their readers, we rely on the dials and gauges on our household appliances, and we use mapping apps on our smartphones to find our way.
This...
