Visualizing Surveys in R
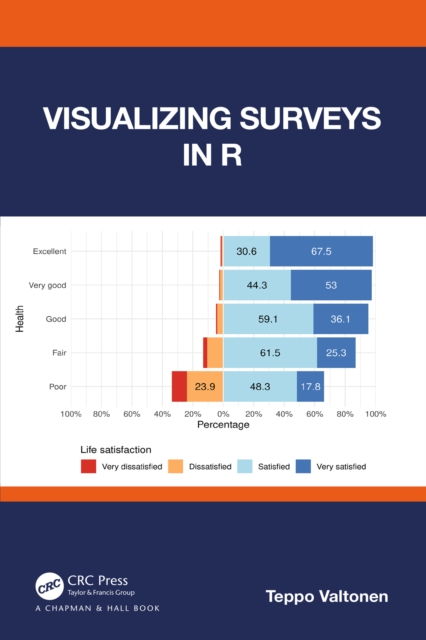
Visualizing Surveys in R is about creating static, print quality figures from survey data using R. The focus is not, for example, on statistical analysis of survey data, but rather on giving concrete solutions for typical problems in visualizing survey data. While there are many excellent books on data visualization, surveys and R, the aim of this book is to bring these topics together, and offer ...
Visualizing Surveys in R is about creating static, print quality figures from survey data using R. The focus is not, for example, on statistical analysis of survey data, but rather on giving concrete solutions for typical problems in visualizing survey data. While there are many excellent books on data visualization, surveys and R, the aim of this book is to bring these topics together, and offer ...
