This edited volume on machine learning and big data analytics (Proceedings of ICDSAI 2023), that was held on April 24-25, 2023 by CSUSB USA, International Association of Academicians (IAASSE), and Lendi Institute of Engineering and Technology, Vizianagaram, India is intended to be used as a reference book for researchers and practitioners in the disciplines of AI and Data Science.
This book presents a novel non-intrusive infrastructure monitoring technique based on the detection and tracking of scattering centers in spaceborne SAR images.
This edited volume focuses on the latest developments in classification and data science and covers a wide range of topics in the context of data analysis and related areas, e.
This edited volume focuses on the latest developments in classification and data science and covers a wide range of topics in the context of data analysis and related areas, e.
This book comprehensively covers the important efforts in improving the quality of images in visual cryptography (VC), with a focus on cases with gray scale images.
This book presents a novel non-intrusive infrastructure monitoring technique based on the detection and tracking of scattering centers in spaceborne SAR images.
This book offers an overview of traditional big visual data analysis approaches and provides state-of-the-art solutions for several scene comprehension problems, indoor/outdoor classification, outdoorscene classification, and outdoor scene layout estimation.
This book is a collection of selected research papers presented at the Mathematics, Statistics and Computing Technology (ICMSCT2023), held at the UST Angelicum College, Philippines, from 20th to 21st September 2023.
This edited volume on machine learning and big data analytics (Proceedings of ICDSAI 2023), that was held on April 24-25, 2023 by CSUSB USA, International Association of Academicians (IAASSE), and Lendi Institute of Engineering and Technology, Vizianagaram, India is intended to be used as a reference book for researchers and practitioners in the disciplines of AI and Data Science.
This book is a comprehensive and rigorous guide to MATLAB for Civil Engineers, bridging the critical gap between theoretical mathematics and practical engineering solutions.
This book is a comprehensive and rigorous guide to MATLAB for Civil Engineers, bridging the critical gap between theoretical mathematics and practical engineering solutions.
Falling Liquid Films gives a detailed review of state-of-the-art theoretical, analytical and numerical methodologies, for the analysis of dissipative wave dynamics and pattern formation on the surface of a film falling down a planar inclined substrate.
This book gathers selected and peer-reviewed contributions presented at the 18th Conference of the International Federation of Classification Societies (IFCS 2024), held in San José, Costa Rica, July 15–19, 2024.
This work presents a data visualization technique that combines graph-based topology representation and dimensionality reduction methods to visualize the intrinsic data structure in a low-dimensional vector space.
A powerful new image presentation technique has evolved over the last twenty years, and its value demonstrated through its support of many and varied common tasks.
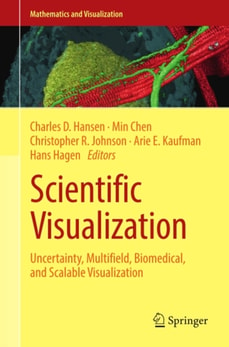
Based on the seminar that took place in Dagstuhl, Germany in June 2011, this contributed volume studies the four important topics within the scientific visualization field: uncertainty visualization, multifield visualization, biomedical visualization and scalable visualization.
This text reviews the evolution of the field of visualization, providing innovative examples from various disciplines, highlighting the important role that visualization plays in extracting and organizing the concepts found in complex data.
SummaryGnuplot in Action, Second Edition is a major revision of this popular and authoritative guide for developers, engineers, and scientists who want to learn and use gnuplot effectively.
This book is a collection of selected research papers presented at the Mathematics, Statistics and Computing Technology (ICMSCT2023), held at the UST Angelicum College, Philippines, from 20th to 21st September 2023.
This book comprehensively covers the important efforts in improving the quality of images in visual cryptography (VC), with a focus on cases with gray scale images.
This book addresses growing demand in the visual humanities for foundational knowledge in data analysis, image processing, and artificial intelligence.
This book addresses growing demand in the visual humanities for foundational knowledge in data analysis, image processing, and artificial intelligence.
ARM Assembly Language: Fundamentals and Techniques, Third Edition explains in clear terms how ARM processors are programmed at the most fundamental level.
As businesses increasingly rely on data to drive decisions, the role of advanced analytics and AI in enhancing data interpretation is becoming crucial.
This concise and accessible guide equips readers with the knowledge and skills needed to implement digital control algorithms to design efficient and reliable power converters using STM32 microcontrollers.
Biomedical Robots and Devices in Healthcare: Opportunities and Challenges for Future Applications explores recent advances and challenges involved in using these techniques in healthcare and biomedical engineering, offering insights and guidance to researchers, professionals, and graduate students interested in this area.
Biomedical Robots and Devices in Healthcare: Opportunities and Challenges for Future Applications explores recent advances and challenges involved in using these techniques in healthcare and biomedical engineering, offering insights and guidance to researchers, professionals, and graduate students interested in this area.
The first book that delivers data viz best practices precisely for Power BIThis practical guide shows how to quickly create visualizations and build savvy dashboards, with 25 chapters that explore different chart types plus 40 visuals from the AppSource gallery, from default to advanced, all over 400 color pages.
This book provides an overview of the many visualization strategies that have been proposed in recent decades for solving problems within the disciplines of medicine and biology.
Applying Color Theory to Digital Media and Visualization provides an overview of the application of color theory concepts to digital media and visualization.
This book explores the interdisciplinary nature of machine learning in multimedia, highlighting its intersections with fields such as computer vision, natural language processing, and audio signal processing.