The first book that delivers data viz best practices precisely for Power BIThis practical guide shows how to quickly create visualizations and build savvy dashboards, with 25 chapters that explore different chart types plus 40 visuals from the AppSource gallery, from default to advanced, all over 400 color pages.
As businesses increasingly rely on data to drive decisions, the role of advanced analytics and AI in enhancing data interpretation is becoming crucial.
Mindcraft ist mehr als nur ein Begriff – es ist ein Werkzeug, um Ihren Geist zu stärken, Ihre Kreativität zu entfalten und Ihre Ziele mit Klarheit zu verfolgen.
ARM Assembly Language: Fundamentals and Techniques, Third Edition explains in clear terms how ARM processors are programmed at the most fundamental level.
Datenvisualisierungen meisterhaft gestalten- Optimieren Sie Ihre Visualisierungen mit Farbtheorie und Typografie- Setzen Sie universelle Designprinzipien um- Erstellen Sie interaktive und überzeugende Visualisierungen Dieses Buch vermittelt zentrale Designkonzepte für die Erstellung klarer und ansprechender Datenvisualisierungen.
The literary response to the dawning cult of wakefulness A turn-of-the-century influx of new technologies and the enormous impact of the electric light transformed not only individual sleeping habits but the ways American culture conceived and valued sleep.
This book provides an overview of the many visualization strategies that have been proposed in recent decades for solving problems within the disciplines of medicine and biology.
This edited book explores the breadth of approaches undertaken by scientists, artists and communicators in their crucial role making science accessible, engaging and impactful.
This edited book explores the breadth of approaches undertaken by scientists, artists and communicators in their crucial role making science accessible, engaging and impactful.
Analytics projects are frequently long, drawn-out affairs, requiring multiple teams and skills to clean, join, and eventually turn data into analysis for timely decision-making.
Analytics projects are frequently long, drawn-out affairs, requiring multiple teams and skills to clean, join, and eventually turn data into analysis for timely decision-making.
This book is designed as a reference text and provides a comprehensive overview of conceptual and practical knowledge about deep learning in medical image processing techniques.
This book presents a comprehensive overview of Structural Equation Modeling and how it can be applied to address research issues in different disciplines.
This book presents a comprehensive overview of Structural Equation Modeling and how it can be applied to address research issues in different disciplines.
Datenvisualisierungen meisterhaft gestalten- Optimieren Sie Ihre Visualisierungen mit Farbtheorie und Typografie- Setzen Sie universelle Designprinzipien um- Erstellen Sie interaktive und überzeugende Visualisierungen Dieses Buch vermittelt zentrale Designkonzepte für die Erstellung klarer und ansprechender Datenvisualisierungen.
Principles of Multimedia introduces and explains the theoretical concepts related to the representation, storage, compression, transmission and processing of various multimedia components, including text, image, graphics, audio, video and animation, as well as their use across various applications.
Clifford algebra for dual quaternions has emerged recently as an alternative to standard matrix algebra as a computational framework for computer graphics.
Clifford algebra for dual quaternions has emerged recently as an alternative to standard matrix algebra as a computational framework for computer graphics.
In today's world, organizations face a multitude of problems that require an unprecedented need for tools to share information and work better together.
In today's data-driven world, earning the Tableau Certified Data Analyst credential signals your ability to connect, analyze, and communicate insights using one of the industry's leading visualization platforms.
In today's data-driven world, earning the Tableau Certified Data Analyst credential signals your ability to connect, analyze, and communicate insights using one of the industry's leading visualization platforms.
Implement real-world machine learning in a microservices architecture as well as design, build, and deploy intelligent microservices systems using examples and case studiesPurchase of the print or Kindle book includes a free PDF eBookKey FeaturesDesign, build, and run microservices systems that utilize the full potential of machine learningDiscover the latest models and techniques for combining microservices and machine learning to create scalable systemsImplement machine learning in microservices architecture using open source applications with pros and consBook DescriptionWith the rising need for agile development and very short time-to-market system deployments, incorporating machine learning algorithms into decoupled fine-grained microservices systems provides the perfect technology mix for modern systems.
The text presents aspects of virtual worlds and highlights the emerging trends in simulation and modeling, comprising machine learning, artificial intelligence, deep learning, robotics, cloud computing, and data mining algorithms.
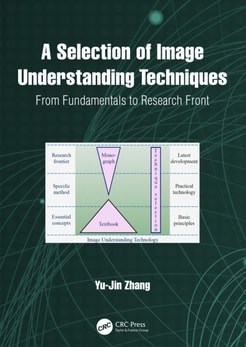
As the first book of a three-part series, this book is offered as a tribute to pioneers in vision, such as Bela Julesz, David Marr, King-Sun Fu, Ulf Grenander, and David Mumford.
This book provides a practical and comprehensive introduction to computational problem solving from the viewpoints of practitioners in both academic and industrial worlds.
This book is intended to serve as a bridge in statistics for graduates and business practitioners interested in using their skills in the area of data science and analytics as well as statistical analysis in general.
This book is intended to serve as a bridge in statistics for graduates and business practitioners interested in using their skills in the area of data science and analytics as well as statistical analysis in general.
Discover the use of graph networks to develop a new approach to data science using theoretical and practical methods with this expert guide using Python, printed in colorKey FeaturesCreate networks using data points and informationLearn to visualize and analyze networks to better understand communitiesExplore the use of network data in both - supervised and unsupervised machine learning projectsPurchase of the print or Kindle book includes a free PDF eBookBook DescriptionNetwork analysis is often taught with tiny or toy data sets, leaving you with a limited scope of learning and practical usage.
Understand and build beautiful and advanced plots with Matplotlib and PythonKey FeaturesPractical guide with hands-on examples to design interactive plotsAdvanced techniques to constructing complex plotsExplore 3D plotting and visualization using Jupyter NotebookBook DescriptionIn this book, you'll get hands-on with customizing your data plots with the help of Matplotlib.
Create dynamic dashboards to bring interactive data visualization to your enterprise using Qlik SenseKey FeaturesImplement various Qlik Sense features to create interactive dashboardsAnalyze data easily and make business decisions faster using Qlik SensePerform self-service data analytics and geospatial analytics using an example-based approachBook DescriptionQlik Sense allows you to explore simple-to-complex data to reveal hidden insights and data relationships to make business-driven decisions.