This practical guide provides more than 150 recipes to help you generate high-quality graphs quickly, without having to comb through all the details of Rs graphing systems.
This practical guide provides more than 150 recipes to help you generate high-quality graphs quickly, without having to comb through all the details of Rs graphing systems.
Its tough to argue with R as a high-quality, cross-platform, open source statistical software productunless youre in the business of crunching Big Data.
In recent years, there has been a tremendous development in the area of quantitative and statistical analysis of linguistic and literary data, generated, no doubt, by extensive advances in computer technology and their relatively easy availability to scholars.
This textbook presents an introduction to generalized linear models, complete with real-world data sets and practice problems, making it applicable for both beginning and advanced students of applied statistics.
Instead of presenting the standard theoretical treatments that underlie the various numerical methods used by scientists and engineers, Using R for Numerical Analysis in Science and Engineering shows how to use R and its add-on packages to obtain numerical solutions to the complex mathematical problems commonly faced by scientists and engineers.
A new modeling methodology, new inference algorithms, new programming languages, and new hardware are all needed to create a complete Bayesian computing framework.
Data clustering is a highly interdisciplinary field, the goal of which is to divide a set of objects into homogeneous groups such that objects in the same group are similar and objects in different groups are quite distinct.
Often considered more of an art than a science, books on clustering have been dominated by learning through example with techniques chosen almost through trial and error.
Beginning R: An Introduction to Statistical Programming is a hands-on book showing how to use the R language, write and save R scripts, build and import data files, and write your own custom statistical functions.
From basic data mining concepts to state-of-the-art advances, this book covers the theory of the subject as well as its application in a variety of fields.
A culmination of the authors' years of extensive research on this topic, Relational Data Clustering: Models, Algorithms, and Applications addresses the fundamentals and applications of relational data clustering.
Computational physics is a rapidly growing subfield of computational science, in large part because computers can solve previously intractable problems or simulate natural processes that do not have analytic solutions.
* Designed for use by novice computer users, this text begins with the basics, such as starting SPSS, defining variables, and entering and saving data.
* Designed for use by novice computer users, this text begins with the basics, such as starting SPSS, defining variables, and entering and saving data.
Sufficient dimension reduction is a rapidly developing research field that has wide applications in regression diagnostics, data visualization, machine learning, genomics, image processing, pattern recognition, and medicine, because they are fields that produce large datasets with a large number of variables.
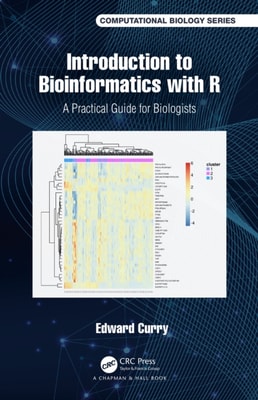
In biological research, the amount of data available to researchers has increased so much over recent years, it is becoming increasingly difficult to understand the current state of the art without some experience and understanding of data analytics and bioinformatics.
In biological research, the amount of data available to researchers has increased so much over recent years, it is becoming increasingly difficult to understand the current state of the art without some experience and understanding of data analytics and bioinformatics.
Written for those with little or no experience in using computers for statistical analysis, this book introduces SPSS/PC+, the market leader PC package.