Introduces the graphical capabilities of R to readers new to the software Due to its flexibility and availability, R has become the computing software of choice for statistical computing and generating graphics across various fields of research.
Introduces the graphical capabilities of R to readers new to the software Due to its flexibility and availability, R has become the computing software of choice for statistical computing and generating graphics across various fields of research.
Conquer the complexities of this open source statistical language R is fast becoming the de facto standard for statistical computing and analysis in science, business, engineering, and related fields.
Conquer the complexities of this open source statistical language R is fast becoming the de facto standard for statistical computing and analysis in science, business, engineering, and related fields.
The updated guide to the newest graphing calculator from Texas Instruments The TI-Nspire graphing calculator is popular among high school and college students as a valuable tool for calculus, AP calculus, and college-level algebra courses.
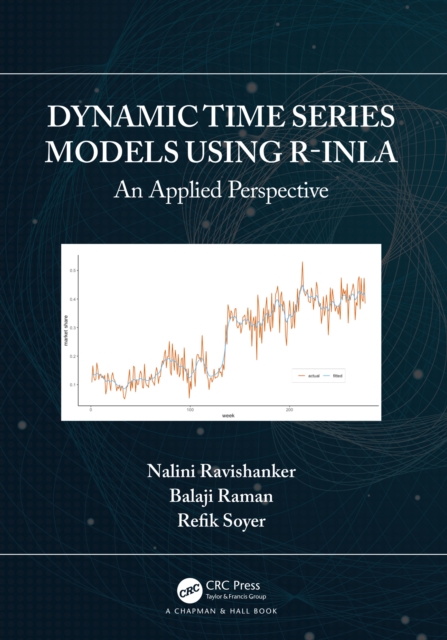
Dynamic Time Series Models using R-INLA: An Applied Perspective is the outcome of a joint effort to systematically describe the use of R-INLA for analysing time series and showcasing the code and description by several examples.
Learn statistical methods quickly and easily with the discovery method With its emphasis on the discovery method, this publication encourages readers to discover solutions on their own rather than simply copy answers or apply a formula by rote.
Master MATLAB(r) step-by-step The MATLAB-- "e;MATrix LABoratory"e;--computational environment offers a rich set of capabilities to efficiently solve a variety of complex analysis, simulation, and optimization problems.
Balanced coverage of the methodology and theory of numerical methods in finance Numerical Methods in Finance bridges the gap between financial theory and computational practice while helping students and practitioners exploit MATLAB for financial applications.
Praise for RiskGrade Your Investments "e;In the same way that the introduction of RiskMetrics raised the level of the discussion (and sometimes debate) regarding market risk measurement and management at large financial institutions, the introduction of RiskGrades and this book represent a major step in the understanding and application of risk measurement and management techniques by individual investors.
Inspired by the author's need for practical guidance in the processes of data analysis, A Practical Guide to Scientific Data Analysis has been written as a statistical companion for the working scientist.
The fun and easy way to learn to use this leading business intelligence tool Written by an author team who is directly involved with SAS, this easy-to-follow guide is fully updated for the latest release of SAS and covers just what you need to put this popular software to work in your business.
The fun and easy way to learn to use this leading business intelligence tool Written by an author team who is directly involved with SAS, this easy-to-follow guide is fully updated for the latest release of SAS and covers just what you need to put this popular software to work in your business.
SPSS (Statistical Package for the Social Sciences) is a data management and analysis software that allows users to generate solid, decision-making results by performing statistical analysis This book provides just the information needed: installing the software, entering data, setting up calculations, and analyzing data Covers computing cross tabulation, frequencies, descriptive ratios, means, bivariate and partial correlations, linear regression, and much more Explains how to output information into striking charts and graphs For ambitious users, also covers how to program SPSS to take their statistical analysis to the next level
After the great expansion of genome-wide association studies, their scientific methodology and, notably, their data analysis has matured in recent years, and they are a keystone in large epidemiological studies.
After the great expansion of genome-wide association studies, their scientific methodology and, notably, their data analysis has matured in recent years, and they are a keystone in large epidemiological studies.
The essential guide to MATLAB as a problem solving tool This text presents MATLAB both as a mathematical tool and a programming language, giving a concise and easy to master introduction to its potential and power.
This book introduces the foundations of multilevel models, using Monopoly(R) rent data, from the classic board game, and the statistical program Stata(R).
This book provides an introduction to chemical engineering analysis- which reviews the processes and designs used to manufacture, use, and dispose of chemical products-and to Mathematica, one of the most powerful mathematical software tools available for symbolic, numerical, and graphical computing.
The Third Edition of the Differential Equations with Mathematica integrates new applications from a variety of fields,especially biology, physics, and engineering.
For all engineers and students coming to finite element analysis or to ANSYS software for the first time, this powerful hands-on guide develops a detailed and confident understanding of using ANSYS's powerful engineering analysis tools.