Create stunning infographics with this hands-on guide Infographics For Dummies is a comprehensive guide to creating data visualization with viral appeal.
Data is a fantastic raw resource for powering change in an organization, but all too often the people working in those organizations don't have the necessary skills to communicate with data effectively.
Data is a fantastic raw resource for powering change in an organization, but all too often the people working in those organizations don't have the necessary skills to communicate with data effectively.
Field Guide to Compelling Analytics is written for Analytics Professionals (APs) who want to increase their probability of success in implementing analytical solutions.
Field Guide to Compelling Analytics is written for Analytics Professionals (APs) who want to increase their probability of success in implementing analytical solutions.
With the tremendous growth and availability of the data, this book covers understanding the data, while telling a story with visualization including basic concepts about the data, the relationship and the visualizations.
With the tremendous growth and availability of the data, this book covers understanding the data, while telling a story with visualization including basic concepts about the data, the relationship and the visualizations.
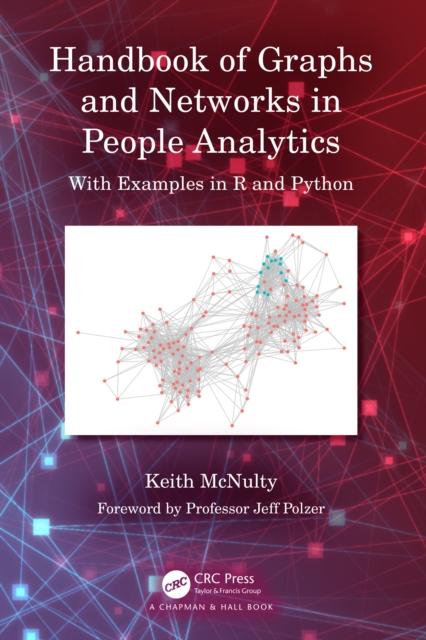
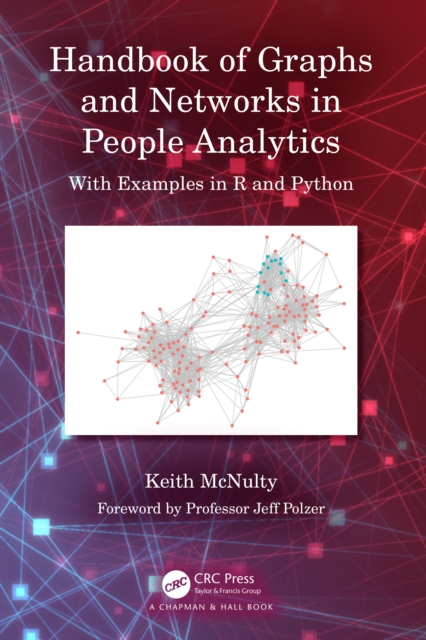
Handbook of Graphs and Networks in People Analytics: With Examples in R and Python covers the theory and practical implementation of graph methods in R and Python for the analysis of people and organizational networks.
Handbook of Graphs and Networks in People Analytics: With Examples in R and Python covers the theory and practical implementation of graph methods in R and Python for the analysis of people and organizational networks.
Unsupervised Learning Approaches for Dimensionality Reduction and Data Visualization describes such algorithms as Locally Linear Embedding (LLE), Laplacian Eigenmaps, Isomap, Semidefinite Embedding, and t-SNE to resolve the problem of dimensionality reduction in the case of non-linear relationships within the data.
Unsupervised Learning Approaches for Dimensionality Reduction and Data Visualization describes such algorithms as Locally Linear Embedding (LLE), Laplacian Eigenmaps, Isomap, Semidefinite Embedding, and t-SNE to resolve the problem of dimensionality reduction in the case of non-linear relationships within the data.
Although the web and online SAS(R) communities can provide volumes of information for programmers, these resources are often overwhelming and lack a simple path to guide coding SAS.
Although the web and online SAS(R) communities can provide volumes of information for programmers, these resources are often overwhelming and lack a simple path to guide coding SAS.
Computers, Commmunication, and Mental Models is a far-ranging, focused treatment of the cognitive and behavioural issues in computer-mediated communication, knowledge representation and computer-supported co- operative work.
Information Visualization in the Era of Innovative Journalism brings together over 30 authors from countries around the world to synthesize how recent technological innovations have impacted the development, practice and consumption of contemporary journalism.
Advances in Discrete Tomography and Its Applications is a unified presentation of new methods, algorithms, and select applications that are the foundations of multidimensional image reconstruction by discrete tomographic methods.
With Python, C++, FORTRAN, and a friendly conversational tone peppered with attempted humor, Modeling and Simulation of Everyday Things takes us on a journey through constructing models and simulations of systems and processes in everyday life and beyond.
The richly illustrated Interactive Web-Based Data Visualization with R, plotly, and shiny focuses on the process of programming interactive web graphics for multidimensional data analysis.
The richly illustrated Interactive Web-Based Data Visualization with R, plotly, and shiny focuses on the process of programming interactive web graphics for multidimensional data analysis.
In and out of formal schooling, online and off, today's learners must consume and integrate a level of information that is exponentially larger and delivered through a wider range of formats and viewpoints than ever before.
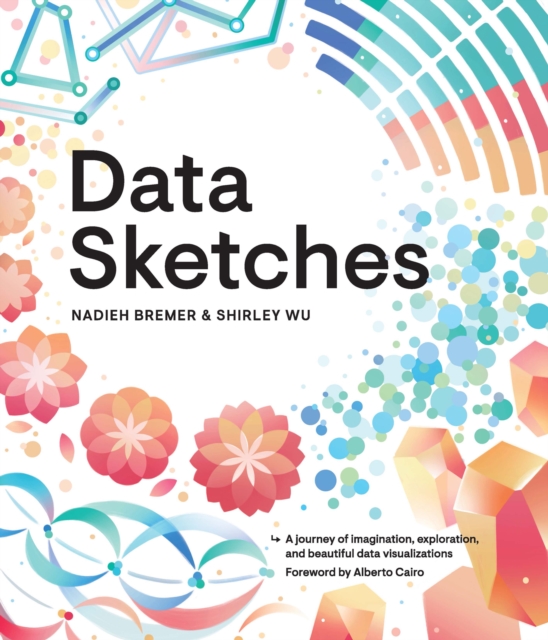
In Data Sketches, Nadieh Bremer and Shirley Wu document the deeply creative process behind 24 unique data visualization projects, and they combine this with powerful technical insights which reveal the mindset behind coding creatively.
In Data Sketches, Nadieh Bremer and Shirley Wu document the deeply creative process behind 24 unique data visualization projects, and they combine this with powerful technical insights which reveal the mindset behind coding creatively.
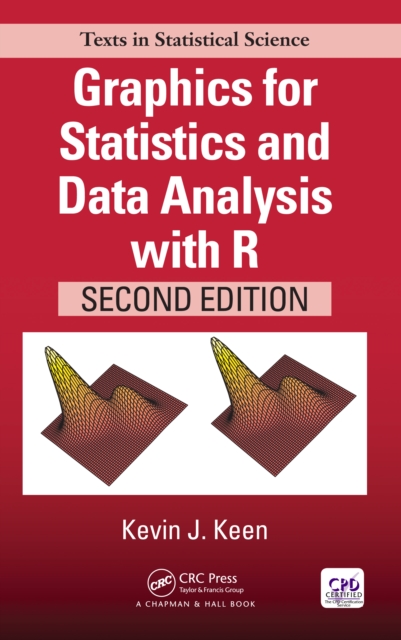
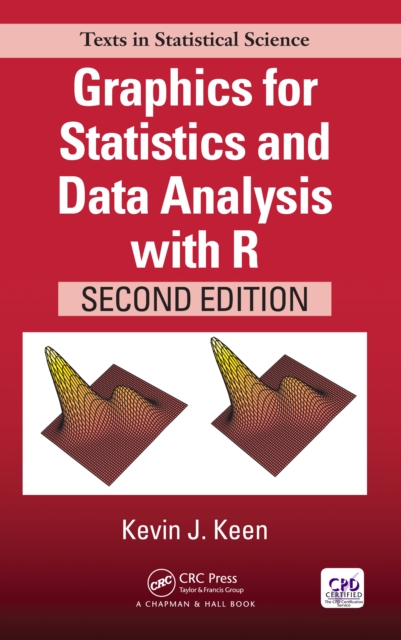
Praise for the First Edition"e;The main strength of this book is that it provides a unified framework of graphical tools for data analysis, especially for univariate and low-dimensional multivariate data.
Praise for the First Edition"e;The main strength of this book is that it provides a unified framework of graphical tools for data analysis, especially for univariate and low-dimensional multivariate data.
This richly illustrated book introduces the reader to a newly developed theory in Computer Vision yielding elementary techniques to analyze digital images.
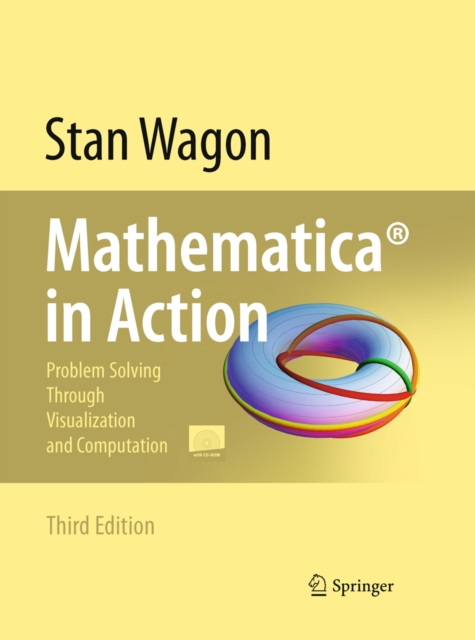
This book is an example-based introduction to techniques, from elementary to advanced, of using Mathematica, a revolutionary tool for mathematical computation and exploration.
This book is about using interactive and dynamic plots on a computer screen as part of data exploration and modeling, both alone and as a partner with static graphics and non-graphical computational methods.