About the Author: Frederick Pearson has extensive experience in teaching map projection at the Air Force Cartography School and Virginia Polytechnic Institute.
About the Author: Frederick Pearson has extensive experience in teaching map projection at the Air Force Cartography School and Virginia Polytechnic Institute.
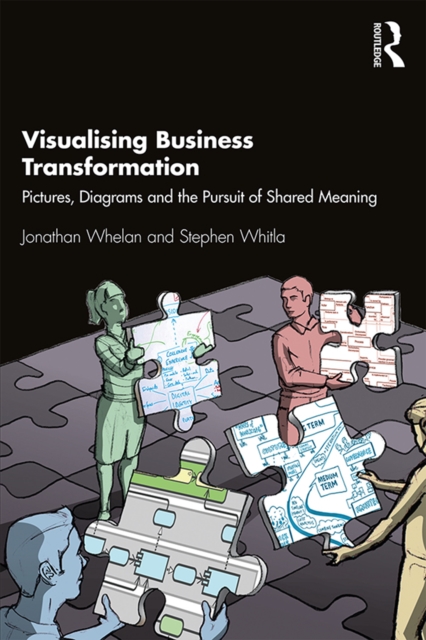
Business transformation typically involves a wide range of visualisation techniques, from the templates and diagrams used by managers to make better strategic choices, to the experience maps used by designers to understand customer needs, the technical models used by architects to propose possible solutions, and the pictorial representations used by change managers to engage stakeholder groups in dialogue.
Business transformation typically involves a wide range of visualisation techniques, from the templates and diagrams used by managers to make better strategic choices, to the experience maps used by designers to understand customer needs, the technical models used by architects to propose possible solutions, and the pictorial representations used by change managers to engage stakeholder groups in dialogue.
Data Visualization Made Simple is a practical guide to the fundamentals, strategies, and real-world cases for data visualization, an essential skill required in today's information-rich world.
Data Visualization Made Simple is a practical guide to the fundamentals, strategies, and real-world cases for data visualization, an essential skill required in today's information-rich world.
"e;Founded by the British Cartographic Society (BCS) and first published in June 1964, The Cartographic Journal was the first general distribution English language journal in cartography.
"e;Founded by the British Cartographic Society (BCS) and first published in June 1964, The Cartographic Journal was the first general distribution English language journal in cartography.
This book explores the increasing altruistic impulse of the design community to address some of the world's most difficult problems including social, political, environmental, and global health causes at the local, national, and global scale.
This book explores the increasing altruistic impulse of the design community to address some of the world's most difficult problems including social, political, environmental, and global health causes at the local, national, and global scale.
For many outside of the scientific community, big data and the forms it takes, such as statistical lists, spreadsheets and graphs, often seem abstract and unintelligible.
For many outside of the scientific community, big data and the forms it takes, such as statistical lists, spreadsheets and graphs, often seem abstract and unintelligible.
With Python, C++, FORTRAN, and a friendly conversational tone peppered with attempted humor, Modeling and Simulation of Everyday Things takes us on a journey through constructing models and simulations of systems and processes in everyday life and beyond.
This book offers an engaging and accessible introduction to data visualization for communicators, covering everything from data collection and analysis to the creation of effective data visuals.
This book offers an engaging and accessible introduction to data visualization for communicators, covering everything from data collection and analysis to the creation of effective data visuals.
Designing Data Reports that Work provides research-based best practices for constructing effective data systems in schools and for designing reports that are relevant, necessary, and easily understood.
Designing Data Reports that Work provides research-based best practices for constructing effective data systems in schools and for designing reports that are relevant, necessary, and easily understood.
The Handbook of Human-Machine Interaction features 20 original chapters and a conclusion focusing on human-machine interaction (HMI) from analysis, design and evaluation perspectives.
Publisher's Note: Products purchased from Third Party sellers are not guaranteed by the publisher for quality, authenticity, or access to any online entitlements included with the product.
With this new edition, Science and Technical Writing confirms its position as the definitive style resource for thousands of established and aspiring technical writers.
With this new edition, Science and Technical Writing confirms its position as the definitive style resource for thousands of established and aspiring technical writers.
This collection examines the promise and limitations for computer-assisted language learning of emerging speech technologies: speech recognition, text-to-speech synthesis, and acoustic visualization.
This collection examines the promise and limitations for computer-assisted language learning of emerging speech technologies: speech recognition, text-to-speech synthesis, and acoustic visualization.
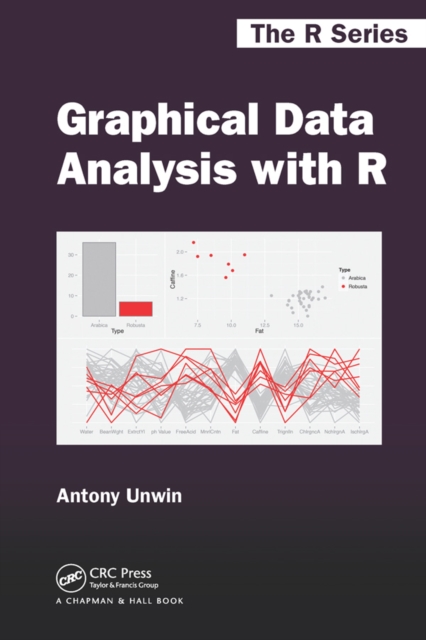
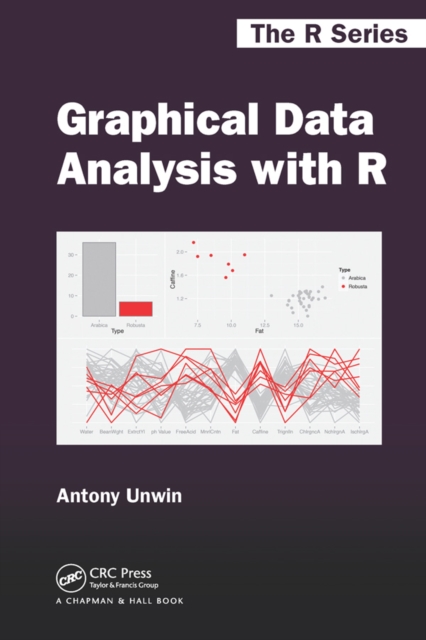
The book provides a foundational guide to statistical computing and visualisation Using R programming with an emphasis on practical data analysis skills that are directly applicable to diverse fields like finance, defence, health, and education.
The amount of information available for any realistic complex situation is likely to overwhelm most users, as well as stymie any designer tasked with presenting the information.
The amount of information available for any realistic complex situation is likely to overwhelm most users, as well as stymie any designer tasked with presenting the information.
The book provides a foundational guide to statistical computing and visualisation Using R programming with an emphasis on practical data analysis skills that are directly applicable to diverse fields like finance, defence, health, and education.
This major reference presents the challenges, issues and directions of computer-based visualization of the natural and built environment and the role of such visualization in landscape and environmental planning.
This major reference presents the challenges, issues and directions of computer-based visualization of the natural and built environment and the role of such visualization in landscape and environmental planning.
Create stunning infographics with this hands-on guide Infographics For Dummies is a comprehensive guide to creating data visualization with viral appeal.