The field of high technology focuses on new, rapidly developing technologies, which include electronic technology, new material technology, new energy technology, bioengineering technology, and communication technology.
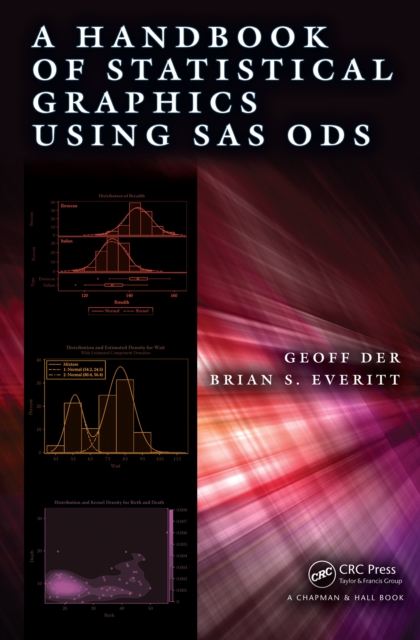
Easily Use SAS to Produce Your GraphicsDiagrams, plots, and other types of graphics are indispensable components in nearly all phases of statistical analysis, from the initial assessment of the data to the selection of appropriate statistical models to the diagnosis of the chosen models once they have been fitted to the data.
Visualization and Verbalization of Data shows how correspondence analysis and related techniques enable the display of data in graphical form, which results in the verbalization of the structures in data.
Newcomers to quantitative analysis need practical guidance on how to analyze data in the real world yet most introductory books focus on lengthy derivations and justifications instead of practical techniques.
Imaging Heat and Mass Transfer Processes: Visualization and Analysis applies Schlieren and shadowgraph techniques to complex heat and mass transfer processes.
The inverse scattering problem is central to many areas of science and technology such as radar and sonar, medical imaging, geophysical exploration and nondestructive testing.
Writing Virtual Environments for Software Visualization book describes the software for a networked, 3D multi-user virtual environment that allows users to create and share remotely visualizations of program behavior.
This book presents a collection of papers from the Spring 1995 Work- shop on Computational Approaches to Processing the Prosody of Spon- taneous Speech, hosted by the ATR Interpreting Telecommunications Re- search Laboratories in Kyoto, Japan.
As everyday tasks grow more confusing, and as social and global problems grow more complex, the information designer's role in bringing clarity has reached a new level of importance.
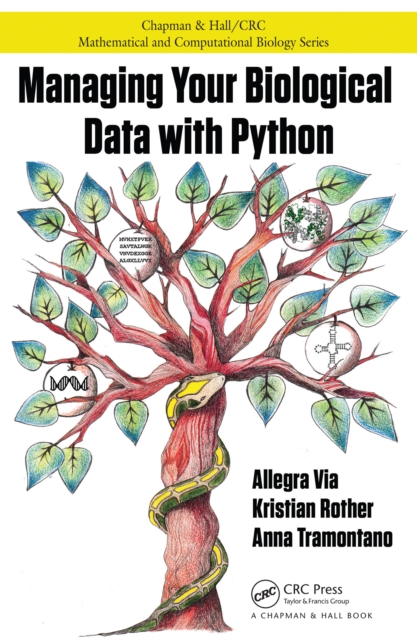
Take Control of Your Data and Use Python with ConfidenceRequiring no prior programming experience, Managing Your Biological Data with Python empowers biologists and other life scientists to work with biological data on their own using the Python language.
This non-traditional introduction to the mathematics of scientific computation describes the principles behind the major methods, from statistics, applied mathematics, scientific visualization, and elsewhere, in a way that is accessible to a large part of the scientific community.
Hailed on first publication as a compendium of foundational principles and cutting-edge research, The Human-Computer Interaction Handbook has become the gold standard reference in this field.
First published two decades ago, the first edition of Handbook of Control Room Design and Ergonomics: A Perspective for the Future became a benchmark for the field.
Data Mining for Design and Marketing shows how to design and integrate data mining tools into human thinking processes in order to make better business decisions, especially in designing and marketing products and systems.
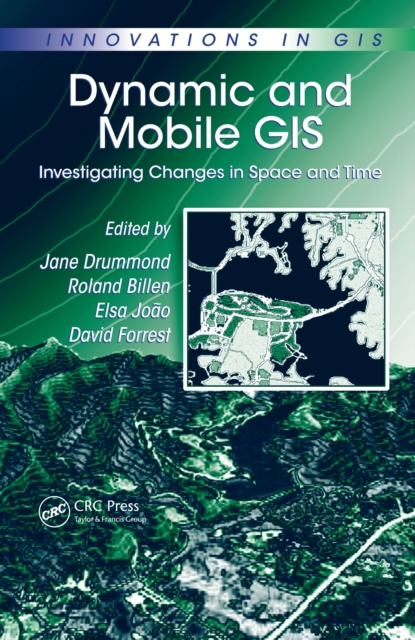
Although the dynamic aspect of the world is widely recognized, information systems have lagged in their ability to represent these dynamics and provide support for users and analysts, especially those who work with dynamic geographic domains.
The world is ever changing, and a comprehensive understanding of the world will not be achieved without theoretical and methodological advances to decode complex dynamics in human and environmental systems.
The explosion of public interest in the natural environment can, to a large extent, be attributed to greater public awareness of the impacts of global warming and climate change.
Interactive Graphics for Data Analysis: Principles and Examples discusses exploratory data analysis (EDA) and how interactive graphical methods can help gain insights as well as generate new questions and hypotheses from datasets.
Get an In-Depth Understanding of Graph Drawing Techniques, Algorithms, Software, and ApplicationsThe Handbook of Graph Drawing and Visualization provides a broad, up-to-date survey of the field of graph drawing.
With the widespread use of PDAs, wireless internet, Internet-based GIS, and 3G and 4G telecommunications, the technology supporting mobile GIS is rapidly gaining popularity and effectiveness.
The past 20 years can be regarded as the adolescence of geographic information science (GIS), as it grew from a burgeoning area of study into a mature and thriving field.
In the 20th century philosophy of mathematics has to a great extent been dominated by views developed during the so-called foundational crisis in the beginning of that century.
The Power of Networks describes a typology of network-based research practices in the historical disciplines, ranging from the use of quantitative network analysis in cultural, economic, social or political history or religious studies, to novel approaches in the Digital Humanities.
The Power of Networks describes a typology of network-based research practices in the historical disciplines, ranging from the use of quantitative network analysis in cultural, economic, social or political history or religious studies, to novel approaches in the Digital Humanities.
From tracking down information to symbolising human experiences, this book is your guide to telling more effective, empathetic and evidence-based data stories.