Whether you have some experience with Tableau software or are just getting started, this manual goes beyond the basics to help you build compelling, interactive data visualization applications.
Whether you have some experience with Tableau software or are just getting started, this manual goes beyond the basics to help you build compelling, interactive data visualization applications.
Presented at this workshop were mathematical models upon which process control is based and the practical applications of this method of control within industry; case studies include examples from the paper and pulp industry, materials industry and the chemical industry, among others.
Before writing the graphics for SYSTAT in the 1980's, I began by teaching a seminar in statistical graphics and collecting as many different quantitative graphics as I could find.
'Terrifying yet funny, surprising yet predictable, simple yet poignant' Chris PackhamA shocking but informative, eye-catching and witty book of maps that illustrate the perilous state of our planet.
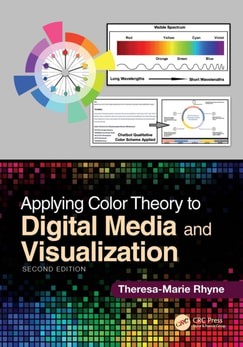
Applying Color Theory to Digital Media and Visualization provides an overview of the application of color theory concepts to digital media and visualization.
This book contains both a synthesis and mathematical analysis of a wide set of algorithms and theories whose aim is the automatic segmen- tation of digital images as well as the understanding of visual perception.
As interactive application software such as apps, installations, and multimedia presentations have become pervasive in everyday life, more and more computer scientists, engineers, and technology experts acknowledge the influence that exists beyond visual explanations.
Wireless sensor networks (WSNs) have many applications ranging from environmental monitoring, security management, and medical applications to smart homes.
The field of high technology focuses on new, rapidly developing technologies, which include electronic technology, new material technology, new energy technology, bioengineering technology, and communication technology.
Approaches to the recovery of three-dimensional information on a biological object, which are often formulated or implemented initially in an intuitive way, are concisely described here based on physical models of the object and the image-formation process.
Imaging Heat and Mass Transfer Processes: Visualization and Analysis applies Schlieren and shadowgraph techniques to complex heat and mass transfer processes.
The inverse scattering problem is central to many areas of science and technology such as radar and sonar, medical imaging, geophysical exploration and nondestructive testing.
Writing Virtual Environments for Software Visualization book describes the software for a networked, 3D multi-user virtual environment that allows users to create and share remotely visualizations of program behavior.
This book presents a collection of papers from the Spring 1995 Work- shop on Computational Approaches to Processing the Prosody of Spon- taneous Speech, hosted by the ATR Interpreting Telecommunications Re- search Laboratories in Kyoto, Japan.
In the 20th century philosophy of mathematics has to a great extent been dominated by views developed during the so-called foundational crisis in the beginning of that century.
Publisher's Note: Products purchased from Third Party sellers are not guaranteed by the publisher for quality, authenticity, or access to any online entitlements included with the product.
Current computer graphics hardware and software make it possible to synthesize near photo-realistic images, but the simulation of natural-looking motion of articulated figures remains a difficultand challenging task.
Current computer graphics hardware and software make it possible to synthesize near photo-realistic images, but the simulation of natural-looking motion of articulated figures remains a difficultand challenging task.
Implement the powerful multimedia and interactive capabilities offered by HTML5, including style control tools, illustration tools, video, audio, and rich media solutions.
Implement the powerful multimedia and interactive capabilities offered by HTML5, including style control tools, illustration tools, video, audio, and rich media solutions.
Create stunning infographics with this hands-on guide Infographics For Dummies is a comprehensive guide to creating data visualization with viral appeal.